Splunk SignalFx
Splunk SignalFx is a cloud-native monitoring and observability platform that provides real-time metrics, tracing, and alerting capabilities to help DevOps teams monitor application performance and infrastructure health.

Power end-to-end data operations for your Splunk SignalFx API with Nexla. Our bi-directional Splunk SignalFx connector is purpose-built for Splunk SignalFx, making it simple to ingest data, sync it across systems, and deliver it anywhere — all with no coding required. Nexla turns API-sourced data into ready-to-use, reusable data products and makes it easy to send data to Splunk SignalFx or any other destination. With comprehensive monitoring, lineage tracking, and access controls, Nexla keeps your Splunk SignalFx workflows fast, secure, and fully governed.
Features
Type: API
- Seamless API Integration: Connect to any endpoint as source or destination without coding, with automatic data product creation
- Visual Composition & Chaining: Build complex integrations using visual templates, chain API calls, and compose workflows with data validation and filtering
- API Proxy: Expose curated slices of your data securely with a secure and customizable API proxy that validates and transforms data on the fly
- Request optimization with intelligent batching, retry, and caching to minimize API calls and costs
Prerequisites
Before creating a Splunk Observability credential, you need to obtain your Organization Access Token and Organization Realm from your Splunk Observability account. Splunk Observability uses token authentication for all API requests, with the token sent in the X-SF-Token header.
To obtain your Splunk Observability credentials, follow these steps:
-
Sign in to your Splunk Observability account using your administrator credentials.
-
Navigate to your profile page in the Splunk Observability UI by clicking your profile icon in the top right corner.
-
Your Organization Realm will be displayed on your profile page. A Observability realm is a self-contained deployment that hosts organizations. Copy the realm name (e.g.,
us0,us1,eu0). -
Navigate to Organization Settings or Access Tokens in your Splunk Observability account.
-
Look for the Access Tokens section, which lists your Organization Access Tokens.
-
If you don't have an Organization Access Token yet, click Create Access Token or Generate Token to create a new Organization Access Token.
-
Configure your Organization Access Token settings:
- Enter a name for the token (e.g., "Nexla Integration")
- Review and select the permissions or scopes for the token (if applicable)
-
Click Create or Generate to create the Organization Access Token.
-
Copy the Organization Access Token immediately after it's generated, as it may not be accessible again after you navigate away from the page.
-
Store both credentials securely, as you will need them to configure your Nexla credential. The Organization Access Token and Organization Realm are sensitive information and should be kept confidential.
The Organization Access Token is sent in the X-SF-Token header for all API requests to the Splunk Observability API. The Organization Realm is used to construct the API endpoint URL (e.g., https://api.{realm}.signalfx.com). The token authenticates your requests and grants access to Splunk Observability resources based on your account permissions. If your Organization Access Token is compromised, you should immediately revoke it in your Splunk Observability account settings and generate a new one. For detailed information about obtaining Organization Access Tokens, API authentication, and available endpoints, refer to the Splunk Observability API documentation.
Authenticate
Credentials required
| Field | Required | Secret | Description |
|---|---|---|---|
| Organization Realm | Yes | No | A SignalFx realm is a self-contained deployment that hosts organizations. You can find your realm name on your profile page in the SignalFx UI. |
| Organization Access Token | Yes | Yes | Enter your SignalFx Org Access Token. You can find them listed as Access Tokens in the SignalFx UI. |
Create a credential in Nexla
- After selecting the data source/destination type, click the Add Credential tile to open the Add New Credential overlay.
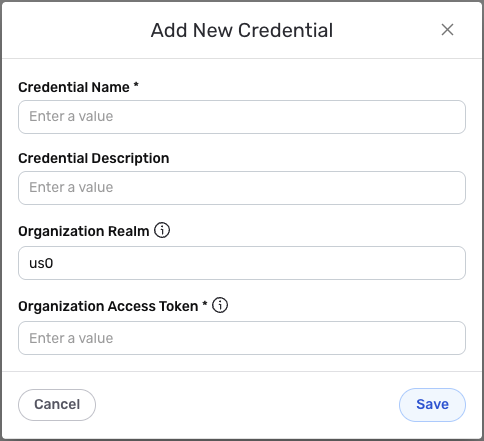
New Credential Overlay – Splunk Observability
-
Enter a name for the credential in the Credential Name field and a short, meaningful description in the Credential Description field.
-
Enter your Organization Realm in the Organization Realm field. This should be your Splunk Observability realm name (e.g.,
us0,us1,eu0). You can find your realm name on your profile page in the Splunk Observability UI. The realm is used to construct the API endpoint URL (e.g.,https://api.{realm}.signalfx.com). -
Enter your Organization Access Token in the Organization Access Token field. This is the Organization Access Token you obtained from your Splunk Observability account settings (Organization Settings > Access Tokens). The Organization Access Token is sent in the
X-SF-Tokenheader for all API requests to the Splunk Observability API. The Organization Access Token is sensitive information and must be kept confidential.Your Splunk Observability credentials can be found in your Splunk Observability account. The Organization Realm can be found on your profile page in the Splunk Observability UI. The Organization Access Token can be found in your Organization Settings > Access Tokens. The Organization Access Token is sent in the
X-SF-Tokenheader for all API requests to the Splunk Observability API.If your Organization Access Token is compromised, you should immediately revoke it in your Splunk Observability account settings and generate a new one. The Organization Access Token provides access to your Splunk Observability account data and should be treated as sensitive information. Keep your credentials secure and do not share them publicly.
For detailed information about obtaining Organization Access Tokens, API authentication, realms in endpoints, and available endpoints, see the Splunk Observability API documentation and Realms in Endpoints documentation.
-
Click the Save button at the bottom of the overlay. The newly added credential will now appear in a tile on the Authenticate screen during data source/destination creation.
Use as a data source
To create a new data flow, navigate to the Integrate section, and click the New Data Flow button. Select the Splunk Observability connector tile, then select the credential that will be used to connect to your Splunk Observability account, and click Next; or, create a new Splunk Observability credential for use in this flow.
Endpoint templates
Nexla provides pre-built templates that can be used to rapidly configure data sources to ingest data from common Splunk Observability endpoints. Select the endpoint from which this source will fetch data from the Endpoint pulldown menu. Available endpoint templates are listed in the expandable boxes below. Click on an endpoint to see more information about it and how to configure your data source for this endpoint.
Once the selected endpoint template has been configured, click the Test button to the right of the endpoint selection menu to retrieve a sample of the data that will be fetched. Sample data will be displayed in the Endpoint Test Result panel on the right, allowing you to verify that the source is configured correctly before saving.
Manual configuration
Splunk Observability data sources can also be manually configured to ingest data from any valid Splunk Observability API endpoint, including endpoints not covered by the pre-built templates, chained API calls, or custom request parameters. Select the Advanced tab at the top of the configuration screen, and follow the instructions in Connect to Any API to configure the API method, endpoint URL, date/time and lookup macros, path to data, metadata, and request headers.
Splunk Observability API endpoint URLs must include your realm (e.g., https://api.{realm}.signalfx.com/v2/event/find, https://api.{realm}.signalfx.com/v2/dashboard). For the Response Data Path, use $[*] to extract all items from a response array, $.results[*] to extract items from a results array, or $ for single-record endpoints, depending on your endpoint. Splunk Observability API uses offset-based pagination with an offset parameter for most endpoints.
Once all of the relevant settings have been configured, click the Create button in the upper right corner of the screen to save and create the new Splunk Observability data source. Nexla will now begin ingesting data from the configured endpoint and will organize any data that it finds into one or more Nexsets.
Use as a destination
Click the + icon on the Nexset that will be sent to the Splunk Observability destination, and select the Send to Destination option from the menu. Select the Splunk Observability connector from the list of available destination connectors, then select the credential that will be used to connect to your Splunk Observability account, and click Next; or, create a new Splunk Observability credential for use in this flow.
Endpoint templates
Nexla provides pre-built templates that can be used to rapidly configure destinations to send data to common Splunk Observability endpoints. Select the endpoint to which data will be sent from the Endpoint pulldown menu. Then, click on the template in the list below to expand it, and follow the instructions to configure additional endpoint settings.
Manual configuration
Splunk Observability destinations can also be manually configured to send data to any valid Splunk Observability API endpoint. Select the Advanced tab at the top of the configuration screen, and follow the instructions in Connect to Any API to configure the API method, data format, endpoint URL, request headers, attribute exclusions, record batching, and response webhooks.
Splunk Observability API typically uses the POST method and expects JSON format for all requests. The destination endpoint URL must include your realm (e.g., https://ingest.{realm}.signalfx.com/v2/datapoint). The request body is typically {message.json} to send the entire Nexset data as JSON, or you can construct a custom JSON structure matching the datapoint, event, or other resource format required by the target endpoint.
Save & activate
Once all endpoint settings have been configured, click the Done button in the upper right corner of the screen to save and create the destination. To send the data to the configured Splunk Observability endpoint, open the destination resource menu, and select Activate.
The Nexset data will not be sent to the Splunk Observability endpoint until the destination is activated. Destinations can be activated immediately or at a later time, providing full control over data movement.