The Finage connector enables you to ingest real-time and historical financial market data — including stock quotes, OHLCV aggregates, forex rates, cryptocurrency prices, fundamental financials, technical indicators, market news, and corporate actions — directly into Nexla data flows. Follow the instructions below to create a new data flow that ingests data from a Finage source in Nexla.
Create a New Data Flow
-
To create a new data flow, navigate to the Integrate section, and click the New Data Flow button. Then, select the desired flow type from the list, and click the Create button.
-
Select the Finage connector tile from the list of available connectors. Then, select the credential that will be used to connect to the Finage instance, and click Next; or, create a new Finage credential for use in this flow.
-
In Nexla, Finage data sources can be created using pre-built endpoint templates, which expedite source setup for common Finage endpoints. Each template is designed specifically for the corresponding Finage endpoint, making source configuration easy and efficient.
• To configure this source using a template, follow the instructions in Configure Using a Template.
Finage sources can also be configured manually, allowing you to ingest data from Finage endpoints not included in the pre-built templates or apply further customizations to exactly suit your needs.
• To configure this source manually, follow the instructions in Configure Manually.
Nexla provides pre-built templates that can be used to rapidly configure data sources to ingest data from common Finage endpoints. Each template is designed specifically for the corresponding Finage endpoint, making data source setup easy and efficient.
Endpoint Settings
- Select the endpoint from which this source will fetch data from the Endpoint pulldown menu. Available endpoint templates are listed in the expandable boxes below. Click on an endpoint to see more information about it and how to configure your data source for this endpoint.
Market News
Retrieves the latest market news headlines for a given stock symbol. Use this endpoint to monitor news sentiment and breaking stories for specific equities, supporting use cases such as event-driven analytics, news-based alerting, and financial research pipelines.
This endpoint returns the most recent news articles available for the symbol at the time of the API call. For continuous news monitoring, schedule your Nexla data flow to run at a regular interval (for example, every 15 minutes). Additional details about the Market News API are available in the Finage Market News documentation.
Technical Indicators
Retrieves computed technical analysis indicator values for a financial instrument over a specified time interval. Use this endpoint to fetch pre-calculated indicators such as SMA, EMA, RSI, DEMA, WMA, TEMA, Williams %R, and ADX for use in quantitative analysis, strategy backtesting, or dashboard visualizations.
Finage's Technical Indicators API computes these values server-side, so no additional calculation is required in your Nexla transformation layer. For more details on supported indicators and their mathematical definitions, see the Finage API documentation.
Earnings Calendar
Retrieves upcoming and recent company earnings announcements from the Finage earnings calendar. Use this endpoint to power financial research workflows, earnings event alerting, or pre-earnings data pipelines.
- This endpoint requires no additional parameters. Selecting this template is all that is needed to retrieve the current earnings calendar data from Finage.
The earnings calendar is updated by Finage as new announcements are confirmed. Schedule your Nexla flow to run daily to keep downstream systems current with the latest earnings events.
Delisted Companies
Returns a list of companies that have been delisted from stock exchanges. Use this endpoint to maintain accurate universe lists, filter out stale symbols from active portfolios, or enrich internal reference data with delisting information.
- This endpoint requires no additional parameters. Selecting this template is all that is needed to retrieve the full delisted companies list from Finage.
IPO Calendar
Retrieves upcoming and recent initial public offerings from the Finage IPO calendar. Use this endpoint to monitor new market entrants, build IPO-based screening tools, or populate research dashboards with upcoming listings.
- This endpoint requires no additional parameters. Selecting this template is all that is needed to retrieve the current IPO calendar from Finage.
The IPO calendar is updated regularly as new filings and pricing dates are confirmed. For time-sensitive IPO monitoring, schedule this flow to run daily or more frequently.
Historical Stock Splits
Retrieves historical stock split events for publicly traded companies. Use this endpoint to adjust historical price data for split events, build corporate actions databases, or enrich equity research workflows.
- This endpoint requires no additional parameters. Selecting this template is all that is needed to retrieve the full historical stock splits dataset from Finage.
Historical Dividends
Retrieves historical dividend payment events for a specific stock symbol, including dividend amounts and payment dates. Use this endpoint to build dividend yield calculators, income analysis workflows, or total return backtesting pipelines.
- Enter the stock ticker symbol in the Symbol field (for example,
AAPL). The endpoint will return all available historical dividend records for that symbol.
Cash Flow Statements
Retrieves historical cash flow statement data for a company, including operating, investing, and financing activities. Use this endpoint for fundamental analysis workflows, financial modeling, and valuation pipelines.
Finage provides up to 30 years of historical fundamentals data for public companies. For comprehensive fundamental analysis, use this endpoint in combination with the Balance Sheet Statements and Income Statement endpoints.
Balance Sheet Statements
Retrieves balance sheet financial statements for a company, including assets, liabilities, and shareholders' equity. Use this endpoint for fundamental analysis, solvency assessment, and financial health monitoring workflows.
Income Statement
Retrieves income statement financial data for a company, including revenue, operating income, net income, and earnings per share. Use this endpoint for profitability analysis, earnings trend monitoring, and valuation model inputs.
Shares Float
Retrieves shares float information for a stock symbol, including the number of shares available for public trading. Use this endpoint to enrich equity analytics, build short-squeeze screening tools, or calculate liquidity metrics.
- Enter the stock ticker symbol in the Symbol field (for example,
AAPL). The endpoint returns current shares float data for that symbol.
Stock OHLCV Aggregates
Returns historical OHLCV (open, high, low, close, volume) aggregate bars for a US stock over a specified date range and time interval. Use this endpoint for technical analysis, backtesting trading strategies, charting applications, and historical price research.
- Enter the stock ticker symbol in the Stock Symbol field (for example,
AAPL). - Enter the multiplier for the time interval in the Multiplier field. For example, enter
1 for single-unit intervals, or 5 for 5-unit intervals (such as 5-minute bars when combined with a minute time interval). Enter the time interval unit in the Time Interval field. Supported values include:
- Enter the start date for the historical data range in the Start Date field using the format
YYYY-MM-DD (for example, 2024-01-01). - Enter the end date for the historical data range in the End Date field using the format
YYYY-MM-DD (for example, 2024-12-31). - Optionally, enter the maximum number of aggregate bars to return in the Limit field. The default is
100. Increase this value for longer date ranges or higher-frequency intervals. Optionally, select the sort order for results in the Sort Order field:
asc — Oldest bars first (default)desc — Newest bars first
For large date ranges or high-frequency intervals (for example, 1-minute bars over several months), set the Limit value appropriately to ensure all bars are retrieved. Finage's OHLCV data for US stocks covers a wide range of historical periods.
Forex Last Quote
Returns the latest bid/ask quote for a forex currency pair. Use this endpoint to retrieve real-time or near-real-time exchange rates for currency conversion, FX risk monitoring, or automated trading triggers.
- Enter the forex pair symbol in the Currency Pair field using the standard six-character format (for example,
EURUSD for Euro/US Dollar or GBPJPY for British Pound/Japanese Yen).
Finage provides access to 3,500+ global currency pairs with real-time bid/ask data. A complete list of supported forex symbols is available in the Finage documentation.
Forex OHLCV Aggregates
Returns historical OHLCV aggregate bars for a forex currency pair over a specified date range and time interval. Use this endpoint for forex strategy backtesting, historical rate analysis, and trend research workflows.
- Enter the forex pair symbol in the Currency Pair field (for example,
EURUSD). - Enter the multiplier for the time interval in the Multiplier field (for example,
1 for single-unit intervals). Enter the time interval unit in the Time Interval field. Supported values include:
- Enter the start date for the historical data range in the Start Date field using the format
YYYY-MM-DD. - Enter the end date in the End Date field using the format
YYYY-MM-DD. - Optionally, enter the maximum number of bars to return in the Limit field. The default is
100. Optionally, select the sort order in the Sort Order field (asc or desc). The default is asc.
Crypto Last Trade
Returns the last trade price for a cryptocurrency pair. Use this endpoint to retrieve the most recent executed trade price for crypto assets in real-time monitoring, alerting, or portfolio valuation workflows.
- Enter the cryptocurrency pair symbol in the Cryptocurrency Pair field (for example,
BTCUSD for Bitcoin/US Dollar or ETHUSD for Ethereum/US Dollar).
Finage provides last trade data for 5,300+ cryptocurrencies. For bid/ask quote data (rather than last trade price), use the Crypto Last Quote endpoint instead.
Crypto OHLCV Aggregates
Returns historical OHLCV aggregate bars for a cryptocurrency pair over a specified date range and time interval. Use this endpoint for crypto strategy backtesting, historical price analysis, and time-series modeling workflows.
- Enter the cryptocurrency pair symbol in the Cryptocurrency Pair field (for example,
BTCUSD). - Enter the multiplier for the time interval in the Multiplier field (for example,
1). Enter the time interval unit in the Time Interval field. Supported values include:
- Enter the start date in the Start Date field using the format
YYYY-MM-DD. - Enter the end date in the End Date field using the format
YYYY-MM-DD. - Optionally, enter the maximum number of bars to return in the Limit field. The default is
100. Optionally, select the sort order in the Sort Order field (asc or desc). The default is asc.
CFD Index Aggregates
Returns historical OHLCV aggregate bars for a CFD (contract for difference) index over a date range at the specified time interval. Use this endpoint to access historical price data for equity indices such as S&P 500, NASDAQ, FTSE, DAX, and others for analysis or index-tracking workflows.
- Enter the CFD index symbol in the Index Symbol field. For example, enter the symbol for the index you want to retrieve (consult the Finage CFD Index documentation for a full list of supported symbols).
Enter the aggregation time interval in the Time Interval field. Supported values include:
- Enter the start date/time in the Start Date/Time field.
- Enter the end date/time in the End Date/Time field.
- Optionally, enter the maximum number of aggregate bars to return in the Limit field. The default is
100. Optionally, select the sort order in the Sort Order field (asc or desc). The default is asc.
Stock End-of-Day OHLCV
Retrieves historical end-of-day OHLCV data for a stock symbol. Use this endpoint for daily price history analysis, end-of-day reporting workflows, and backtesting strategies that operate on daily resolution data.
- Enter the stock ticker symbol in the Symbol field (for example,
AAPL for Apple Inc. or MSFT for Microsoft). The endpoint returns the end-of-day open, high, low, close, and volume data for the specified symbol.
ETF Last Quote/Trade
Retrieves the real-time last quote or trade for an ETF symbol. Use this endpoint to monitor live prices for exchange-traded funds such as SPY, QQQ, IWM, and others for portfolio valuation, alerting, or dashboard display.
- Enter the ETF symbol in the Symbol field (for example,
SPY for SPDR S&P 500 ETF or QQQ for Invesco QQQ Trust).
Crypto Last Quote
Retrieves the last bid/ask quote for a cryptocurrency pair. Use this endpoint when you need the current spread (bid and ask prices) rather than the last executed trade price — useful for market-making analytics, spread monitoring, or real-time pricing displays.
- Enter the cryptocurrency pair symbol in the Symbol field (for example,
BTCUSD).
The Crypto Last Quote endpoint returns bid/ask spread data. For the last executed trade price, use the Crypto Last Trade endpoint instead.
Forex Last Trade
Retrieves the last executed trade for a forex pair, providing the most recent transaction price and timestamp. Use this endpoint when you need the actual last traded rate rather than the bid/ask quote for a currency pair.
- Enter the forex pair symbol in the Symbol field (for example,
EURUSD).
The Forex Last Trade endpoint returns the last executed transaction. For bid/ask quotes, use the Forex Last Quote endpoint instead.
ETF OHLCV Aggregates
Retrieves OHLCV aggregate bars for an ETF symbol over a date range and time interval. Use this endpoint for ETF performance analysis, backtesting fund-based strategies, or populating charting applications with ETF price history.
Financial Ratios
Retrieves key financial ratios for a company, including valuation ratios (P/E, EV/EBITDA), profitability ratios, leverage ratios (debt/equity), and liquidity ratios. Use this endpoint for fundamental screening, relative valuation, and financial health assessment workflows. Finage provides 40+ financial ratios for public companies.
- Enter the stock ticker symbol in the Symbol field (for example,
AAPL). The endpoint returns the current set of financial ratios calculated from the most recent available financial statements for that company.
Index Last Price
Retrieves the real-time last price for a stock index or CFD. Use this endpoint to monitor live index levels for major global indices such as the S&P 500, NASDAQ Composite, FTSE 100, and DAX for dashboard displays, alerting, or index-linked calculations.
- Enter the index or CFD symbol in the Symbol field. Consult the Finage documentation for a list of available index symbols.
Stock Last Quote
Retrieves the real-time last quote (bid price, ask price, and last trade price) for a US stock symbol. Use this endpoint for live equity price monitoring, real-time portfolio valuation, or trade execution decision support.
- Enter the stock ticker symbol in the Symbol field (for example,
AAPL). The endpoint returns the current bid, ask, and last price for the specified US stock.
Stock Last Trade
Retrieves the last trade (price, size, and timestamp) for a US stock symbol. Use this endpoint when you need to capture the most recently executed transaction — useful for trade reporting, tick data capture, or real-time price streaming scenarios.
- Enter the stock ticker symbol in the Symbol field (for example,
AAPL). The endpoint returns the price, share size, and timestamp of the most recent trade executed for the specified symbol.
Crypto Previous Close
Retrieves the previous session's closing price for a cryptocurrency symbol. Use this endpoint for daily change calculations, overnight price movement monitoring, or end-of-day crypto reporting workflows.
- Enter the cryptocurrency symbol in the Symbol field (for example,
BTCUSD).
Forex Previous Close
Retrieves the previous session's closing price for a forex currency pair. Use this endpoint for daily FX change reporting, overnight rate monitoring, or end-of-day currency analytics.
- Enter the forex pair symbol in the Symbol field (for example,
EURUSD).
Stock Previous Close
Retrieves the previous market session's closing price for a US stock. Use this endpoint for daily price change calculations, after-hours monitoring, or close-of-day reporting workflows.
- Enter the stock ticker symbol in the Symbol field (for example,
AAPL). The endpoint returns the previous session's closing price for the specified US stock.
ETF Snapshot
Retrieves a multi-symbol snapshot of last prices and metadata for a list of ETF symbols in a single API call. Use this endpoint for batch ETF portfolio monitoring, multi-fund dashboard displays, or bulk price refresh workflows.
- Enter a comma-separated list of ETF symbols in the Symbols field (for example,
SPY,QQQ,IWM). The endpoint returns a snapshot of the most recent price data for each symbol in the list simultaneously.
The ETF Snapshot endpoint is particularly efficient when you need to monitor multiple ETFs at once, as it retrieves data for all specified symbols in a single request rather than making individual calls for each symbol.
Endpoint Testing
Once the selected endpoint template has been configured, Nexla can retrieve a sample of the data that will be fetched according to the current settings. This allows users to verify that the source is configured correctly before saving.
-
To test the current endpoint configuration, click the Test button to the right of the endpoint selection menu. Sample data will be fetched & displayed in the Endpoint Test Result panel on the right.
-
If the sample data is not as expected, review the selected endpoint and associated settings, and make any necessary adjustments. Then, click the Test button again, and check the sample data to ensure that the correct information is displayed.
Finage data sources can be manually configured to ingest data from any valid Finage REST API endpoint. Manual configuration provides maximum flexibility for accessing endpoints not covered by pre-built templates or when you need custom API configurations such as filtered queries, custom parameter combinations, or chained calls.
With manual configuration, you can also create more complex Finage sources — for example, sources that pass dynamic date range parameters using Nexla macros to fetch rolling windows of OHLCV data, or sources that reference IDs from another Nexla data flow using lookup-based macros.
API Method
-
To manually configure this source, select the Advanced tab at the top of the configuration screen.
-
Select the API method from the Method pulldown menu. For all Finage read endpoints, select GET, as the Finage REST API uses HTTP GET requests for all data retrieval operations.
API Endpoint URL
- Enter the full URL of the Finage API endpoint in the Set API URL field. This should include the complete path and any required path parameters or query parameters. For example, to retrieve OHLCV data for AAPL with a 1-day interval, the URL would follow the pattern:
https://api.finage.co.uk/agg/stock/AAPL/1/day/2024-01-01/2024-12-31.
Do not include your Finage API key in the URL — Nexla passes the API key automatically via the apikey header using the credential you configured. Including the key in the URL is not necessary and could expose it in logs. Full Finage API endpoint reference documentation is available at https://finage.co.uk/docs/api.
Date/Time Macros (API URL)
Optional
Optionally, the API URL can be customized using macros—all macros added to the API URL will be converted into values when Nexla executes the API call. Macros are dynamic placeholders that allow you to create flexible API endpoints that can adapt to different time periods or data requirements.
This is particularly useful for Finage endpoints that accept date range parameters, such as the OHLCV Aggregates endpoints, where you want Nexla to automatically fetch data for the most recent period on each run.
Date/time macros are especially powerful for Finage's OHLCV and historical data endpoints. For example, you can use {now-1} as the end date parameter and {now-30} as the start date parameter to always retrieve the most recent 30-day window of data.
-
To add a macro, type { at the appropriate position in the API URL (within the Set API URL field), and select the desired macro from the dropdown list.
{now} – The current datetime{now-1} – The datetime one time unit before the current datetime{now+1} – The datetime one time unit after the current datetimecustom – Datetime macros can reference any number of time units before or after the current datetime—for example, enter (now-30) to indicate the datetime 30 time units before the current datetime
-
Select the format that will be applied to datetime macros from the Date Format for Date/Time Macro pulldown menu. Finage date parameters use the YYYY-MM-DD format — select this format to ensure compatibility with Finage endpoints that accept date range parameters.
-
Select the datetime unit that will be used to perform mathematical operations in the included macro(s) from the Time Unit for Operations pulldown menu—for example, for the macro {now-1}, when Day is selected, {now-1} will be converted to the datetime one day before the current datetime.
Lookup-Based Macros (API URL)
Optional
Column values from existing lookups can also be included as macros in the API URL. Lookup-based macros allow you to reference data from previously configured data sources or lookups, enabling dynamic API endpoints that can adapt based on existing data.
Lookup-based macros are useful when you need to create Finage API calls that reference dynamic values from other Nexla sources — for example, iterating over a list of stock symbols from a watchlist stored in another Nexset.
-
To include a lookup column value macro, select the relevant lookup from the Add Lookups to Supported Macros pulldown menu.
-
Type { at the appropriate position in the API URL, and select the lookup column-based macro from the dropdown list. Lookup-based macros are automatically populated into the macro list when a lookup is selected in the Add Lookups to Supported Macros pulldown menu.
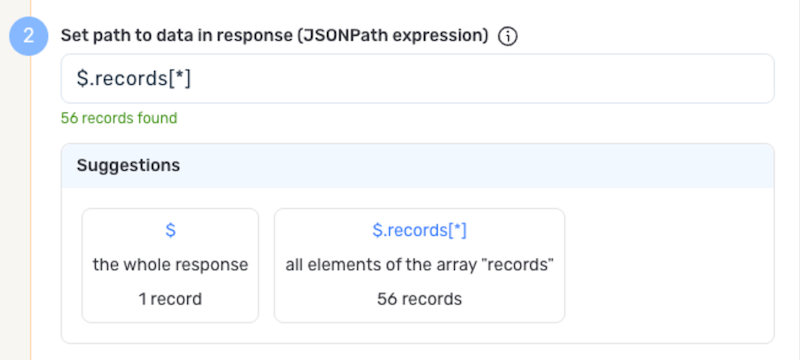
If only a subset of the data returned by the Finage API endpoint is needed, you can designate the relevant part of the response by specifying the path to the data within the response. This is particularly important for Finage endpoints that wrap result arrays in a parent object — for example, the OHLCV Aggregates endpoints return data inside a results array.
For example, the Finage Stock OHLCV Aggregates endpoint returns a response like {"results": [...], "ticker": "AAPL", "count": 100}. By entering $.results[*] as the path to data, Nexla will treat each element in the results array as a separate record.
Always verify the response structure of the Finage endpoint you are calling — the correct path to data depends on the specific endpoint. Use the Test button to fetch a sample response and examine the structure before specifying the path.
Autogenerate Path Suggestions
Nexla can also autogenerate data path suggestions based on the response from the API endpoint. These suggested paths can be used as-is or modified to exactly suit your needs.
-
To use this feature, click the Test button next to the Set API URL field to fetch a sample response from the API endpoint. Suggested data paths generated based on the content & format of the response will be displayed in the Suggestions box below the Set Path to Data in Response field.
-
Click on a suggestion to automatically populate the Set Path to Data in Response field with the corresponding path. The populated path can be modified directly within the field if further customization is needed.
If metadata is included in the response but is located outside of the defined path to relevant data, you can configure Nexla to include this data as common metadata in each record. This is useful when you want to preserve contextual information from the Finage API response — such as the ticker symbol, result count, or request status — alongside the individual data records.
For Finage OHLCV Aggregates endpoints, the response includes top-level fields such as ticker, queryCount, and resultsCount alongside the results array. Specifying a metadata path can preserve this context with each record.
-
If Nexla should include any additional request headers in API calls to this source, enter the headers & corresponding values as comma-separated pairs in the Request Headers field (for example, header1:value1,header2:value2).
You do not need to include the apikey authentication header — Nexla passes it automatically based on your Finage credential configuration. Only include additional headers if a specific Finage endpoint requires them, such as content-type or API versioning headers.
Endpoint Testing
After configuring all settings for the selected endpoint, Nexla can retrieve a sample of the data that will be fetched according to the current configuration. This allows users to verify that the source is configured correctly before saving.
-
To test the current endpoint configuration, click the Test button to the right of the endpoint selection menu. Sample data will be fetched & displayed in the Endpoint Test Result panel on the right.
-
If the sample data is not as expected, review the selected endpoint and associated settings, and make any necessary adjustments. Then, click the Test button again, and check the sample data to ensure that the correct information is displayed.
Save & Activate the Source
- Once all of the relevant steps in the above sections have been completed, click the Create button in the upper right corner of the screen to save and create the new Finage data source. Nexla will now begin ingesting data from the configured endpoint and will organize any data that it finds into one or more Nexsets.