
Breezometer Data Source

BreezoMeter provides real-time and forecast environmental intelligence — air quality, pollen, weather, and active wildfires — for any location worldwide. Follow the instructions below to create a new data flow that ingests data from a Breezometer source in Nexla.
breezometer_api.png

Breezometer

Create a New Data Flow

  1. To create a new data flow, navigate to the Integrate section, and click the New Data Flow button. Then, select the desired flow type from the list, and click the Create button.

  2. Select the Breezometer connector tile from the list of available connectors. Then, select the credential that will be used to connect to the Breezometer instance, and click Next; or, create a new Breezometer credential for use in this flow.

  3. In Nexla, Breezometer data sources can be created using pre-built endpoint templates, which expedite source setup for common Breezometer endpoints. Each template is designed specifically for the corresponding Breezometer endpoint, making source configuration easy and efficient.
    • To configure this source using a template, follow the instructions in Configure Using a Template.

    Breezometer sources can also be configured manually, allowing you to ingest data from Breezometer endpoints not included in the pre-built templates or apply further customizations to exactly suit your needs.
    • To configure this source manually, follow the instructions in Configure Manually.

Configure Using a Template

Nexla provides pre-built templates that can be used to rapidly configure data sources to ingest data from common Breezometer endpoints. Each template is designed specifically for the corresponding Breezometer endpoint, making data source setup easy and efficient.

Endpoint Settings

  • Select the endpoint from which this source will fetch data from the Endpoint pulldown menu. Available endpoint templates are listed in the expandable boxes below. Click on an endpoint to see more information about it and how to configure your data source for this endpoint.

    Air Quality - Current Conditions

    This endpoint returns the current air-quality conditions for a single geographic point — including the BreezoMeter AQI, dominant pollutant, pollutant concentrations, and health recommendations. It also supports point-in-time and range queries against the recent historical window when the relevant datetime parameters are supplied.

    • Enter the geographic latitude in the Latitude field (decimal degrees, for example 48.857456) and the longitude in the Longitude field (for example 2.354611). These two values are the minimum required inputs.
    • To request data for a single past moment, enter an ISO 8601 timestamp in the Datetime field (for example 2026-05-15T14:00:00Z). Leave this field blank to return the latest available conditions.
    • To request a historical range, leave Datetime blank and enter ISO 8601 values in both Start Datetime and End Datetime. The endpoint returns one record per hour within the requested window.
    • To extend the response payload, enter a comma-separated list of feature names in the Features field. Supported values include breezometer_aqi, local_aqi, health_recommendations, sources_and_attribution, pollutants_concentrations, and dominant_pollutant_concentrations.
    • Set the Metadata field to true to include calculation timestamps and data-source attribution alongside each reading.
    • Enter a language code in the Language field (for example en, es, fr) to localize human-readable text such as health recommendations.
    • Set the BreezoMeter AQI Color field to true to include the AQI category color codes used by BreezoMeter visualizations.

    For the full list of supported features, response field reference, and historical data window limits, see the BreezoMeter Air Quality API V2 documentation.

    Air Quality - Hourly Forecast (Specific Datetime)

    This endpoint returns the air-quality forecast for a specific future hour at the requested location. Use it to surface a single forecast slot — for example, to populate "tomorrow at 09:00 AQI" in a downstream system without retrieving the entire forecast window.

    • Enter the location coordinates in the Lat and Lon fields. Both are required.
    • Enter the target forecast time in the Datetime field as an ISO 8601 timestamp (for example 2026-06-02T09:00:00Z). This is required and must fall within BreezoMeter's forecast window (typically up to 96 hours into the future).
    • Optionally, enter a comma-separated list of feature names in the Features field to extend the response (for example local_aqi,health_recommendations,pollutants_concentrations).
    • Set the Metadata field to true to include calculation timestamps and source attribution.
    • Enter a language code in the Lang field to localize human-readable text.

    Air Quality - Hourly History (Specific Datetime)

    This endpoint returns the historical air-quality reading for a specific past hour at the requested location. Use it to backfill a single past moment in a time series — for example, when reconciling sensor data against BreezoMeter readings for a fixed timestamp.

    • Enter the location coordinates in the Lat and Lon fields.
    • Enter the historical timestamp to look up in the Datetime field as an ISO 8601 value. This must fall within the historical window allowed by your BreezoMeter plan.
    • Optionally, enter a comma-separated list of feature names in the Features field to extend the response payload.
    • Set the Metadata field to true to include data-source attribution and timestamps.
    • Enter a language code in the Lang field to localize human-readable text.

    To ingest a continuous historical range rather than a single point, use the Air Quality - Current Conditions endpoint with both Start Datetime and End Datetime populated.

    Get BreezoMeter AQI Heatmap Tile

    This endpoint returns a PNG heatmap tile visualizing current BreezoMeter AQI values for the requested map tile coordinates. Use it to overlay air-quality heatmaps on Mapbox, Leaflet, or Google Maps clients, or to archive geographic snapshots for later analysis.

    • Enter the slippy-map zoom level in the Zoom Level field (an integer between 0 and 21; lower values cover larger areas at lower resolution).
    • Enter the tile X and Y coordinates in the Tile X Coordinate and Tile Y Coordinate fields. These are standard XYZ tile coordinates and can be derived from a latitude/longitude pair using a tile-coordinate utility.
    • Enter the visualization color scheme in the Color Scheme field. The default BreezoMeter palette is used when this field is blank.

    The response is a binary PNG image, not a JSON record. Nexla treats each tile as a binary payload — downstream destinations should be configured to write the response as a file rather than as parsed records. For tile details, see the BreezoMeter Tiles API documentation.

    Monitor Active Wildfires in Area of Interest

    This endpoint returns active wildfire data for the pre-defined Areas of Interest (AoIs) registered against your Wildfire Tracker+ subscription. Use it to drive alerting, dashboards, or downstream automation that reacts to active fires inside a managed footprint (for example, an insurer's covered properties or a utility's service territory).

    • Optionally, enter a comma-separated list of feature names in the Features field to extend the response with additional attributes such as perimeter geometry or smoke plume data.
    • Enter the desired distance/area unit system in the Units field (for example metric or imperial) to control the units used in the response.

    Areas of Interest must be defined in advance by BreezoMeter against your API key. This endpoint does not accept ad-hoc coordinates — use the Wildfire Locate and Track endpoint to query around a specific lat/lon. For details, see the BreezoMeter Wildfire Tracker+ API documentation.

    Get Burnt Area Monitoring Data

    This endpoint returns burnt-area monitoring data for the pre-defined Areas of Interest (AoIs) registered against your Wildfire Tracker+ subscription. Use it to track damage extents after fire activity has subsided — for example, to feed loss-modeling pipelines or environmental impact reporting.

    • Enter the desired distance/area unit system in the Units field (for example metric or imperial) to control the units used in the response.

    Like the active-fire variant, this endpoint operates against AoIs registered with BreezoMeter — it does not accept ad-hoc coordinates. Use Wildfire Burnt Area for point-and-radius queries.

    Get PM2.5 Heatmap Tile

    This endpoint returns a PNG heatmap tile visualizing current PM2.5 (fine particulate matter) concentrations for the requested map tile coordinates. Use it when you need a pollutant-specific overlay rather than the composite BreezoMeter AQI tile.

    • Enter the slippy-map zoom level in the Zoom Level field (an integer between 0 and 21).
    • Enter the tile X and Y coordinates in the Tile X Coordinate and Tile Y Coordinate fields. These are standard XYZ tile coordinates.

    The response is a binary PNG, not JSON. Downstream destinations should be configured to write the response as a file.

    Pollen - Daily Forecast

    This endpoint returns daily forecast pollen conditions for a specific location for 1 to 5 days ahead, including pollen index values for tree, grass, and weed pollen types. Use it to feed pollen-aware health and wellness applications, advertising targeting, or environmental alerting.

    • Enter the location coordinates in the Lat and Lon fields.
    • Enter the number of forecast days to return in the Days field (an integer between 1 and 5).
    • Optionally, enter a comma-separated list of feature names in the Features field to extend the response — for example types_information for per-plant-type metadata, or plants_information for plant-level breakdowns.
    • Set the Metadata field to true to include calculation timestamps and source attribution.
    • Enter a language code in the Lang field to localize human-readable text.

    For the supported feature list and per-plant-type field reference, see the BreezoMeter Pollen API V2 documentation.

    Get Pollen Daily Forecast Heatmap Tile

    This endpoint returns a PNG heatmap tile visualizing daily pollen forecast intensity for the requested map tile coordinates. Use it to overlay pollen heatmaps on map clients or to archive snapshots for time-series visualization.

    • Enter the slippy-map zoom level in the Zoom Level field (an integer between 0 and 21).
    • Enter the tile X and Y coordinates in the Tile X Coordinate and Tile Y Coordinate fields.

    The response is a binary PNG. For tile coverage and refresh cadence, see the BreezoMeter Tiles API documentation.

    Get Traffic Pollution Heatmap Tile

    This endpoint returns a vector tile (PBF — Mapbox vector format) visualizing current traffic-induced air pollution for the requested map tile coordinates. Use it when you need to render street-level pollution as a styleable vector layer rather than a raster overlay.

    • Enter the slippy-map zoom level in the Zoom Level field. This parameter is required.
    • Enter the tile X and Y coordinates in the Tile X Coordinate and Tile Y Coordinate fields. Both are required.

    The response is a binary Mapbox vector tile (.pbf). Configure downstream destinations to write the response as a binary file, and use a Mapbox-compatible client to render the styled layer.

    Weather - Current Conditions

    This endpoint returns the current weather conditions — temperature, apparent temperature, wind speed and direction, humidity, precipitation, and weather code — for a specific location. Use it as a companion to the air-quality and pollen endpoints to enrich environmental records with meteorological context.

    • Enter the location coordinates in the Latitude and Longitude fields. Both are required.
    • Set the Metadata field to true to include calculation timestamps and source attribution in the response.
    • Enter the unit system in the Units field (metric for Celsius/kph, imperial for Fahrenheit/mph).
    • Enter a language code in the Language field to localize human-readable text such as weather descriptions.

    For the complete response field reference, see the BreezoMeter Weather API documentation.

    Weather - Daily Forecast

    This endpoint returns daily weather forecast conditions for a specific location for up to five days ahead, including high/low temperatures, precipitation probability, and dominant weather conditions.

    • Enter the location coordinates in the Lat and Lon fields.
    • Enter the number of forecast days to return in the Days field (an integer between 1 and 5).
    • Set the Metadata field to true to include calculation timestamps and source attribution.
    • Enter the unit system in the Units field (metric or imperial).
    • Enter a language code in the Lang field to localize human-readable text.

    Get Hourly Weather Forecast

    This endpoint returns hourly weather forecast conditions for a specific location for up to 120 hours (five days) ahead. Use it for short-horizon planning workloads that need higher temporal resolution than the daily forecast.

    • Enter the location coordinates in the Latitude and Longitude fields.
    • Enter the number of forecast hours to return in the Number of Hours field (an integer up to 120).
    • Set the Include Metadata field to true to include calculation timestamps and source attribution.
    • Enter the unit system in the Units field (metric or imperial).
    • Enter a language code in the Language field to localize human-readable text.

    For supported feature names and the response field reference, see the BreezoMeter Weather API hourly forecast documentation.

    Wildfire Burnt Area (Point + Radius)

    This endpoint returns burnt-area data for a specific location within a given radius and lookback window after fire extinguishment. Use it for ad-hoc, point-and-radius damage assessments — for example, to evaluate fire impact around a specific address.

    • Enter the location coordinates in the Lat and Lon fields.
    • Enter the search radius in the Radius field (numeric, in the units specified by the Units field).
    • Enter the lookback window in the Daysfromextinguish field — the number of days since fire extinguishment to include in the result set.
    • Enter the desired unit system in the Units field (metric or imperial).

    Wildfire Locate and Track

    This endpoint returns active wildfire conditions and perimeter data for a specific location within a given radius. Use it for ad-hoc wildfire situational awareness around a specific point — for example, to enrich an alert with a list of fires currently burning within 50 km of an asset.

    • Enter the location coordinates in the Latitude and Longitude fields.
    • Enter the search radius in the Radius field (numeric, in the units specified by the Units field).
    • Enter the desired unit system in the Units field (metric or imperial).
    • Optionally, enter a comma-separated list of feature names in the Features field to extend the response with additional attributes such as fire perimeter geometry.

Endpoint Testing

Once the selected endpoint template has been configured, Nexla can retrieve a sample of the data that will be fetched according to the current settings. This allows users to verify that the source is configured correctly before saving.

  • To test the current endpoint configuration, click the Test button to the right of the endpoint selection menu. Sample data will be fetched & displayed in the Endpoint Test Result panel on the right.

  • If the sample data is not as expected, review the selected endpoint and associated settings, and make any necessary adjustments. Then, click the Test button again, and check the sample data to ensure that the correct information is displayed.

Configure Manually

Breezometer data sources can be manually configured to ingest data from any valid Breezometer API endpoint. Manual configuration provides maximum flexibility for accessing endpoints not covered by pre-built templates — for example, the Environmental Alerts Insights Engine, custom feature combinations, or specialized Tiles endpoints.

With manual configuration, you can also create more complex Breezometer sources, such as sources that chain calls across the Air Quality, Pollen, and Weather APIs to assemble a unified environmental record for a given location.

API Method

  1. To manually configure this source, select the Advanced tab at the top of the configuration screen.

  2. Select the API method that will be used for calls to the Breezometer API from the Method pulldown menu. Almost all Breezometer read endpoints use GET:

    • GET: For retrieving data from the API (all Air Quality, Pollen, Weather, Tiles, and Wildfire read endpoints)
    • POST: For Insights endpoints such as Cleanest Route and Environmental Alerts (typically used as destinations)

API Endpoint URL

  1. Enter the URL of the Breezometer API endpoint from which this source will fetch data in the Set API URL field. All Breezometer API URLs are rooted at https://api.breezometer.com/ followed by the product path (for example, https://api.breezometer.com/air-quality/v2/current-conditions or https://api.breezometer.com/pollen/v2/forecast/daily).

The Breezometer credential automatically appends the API key as the key URL parameter on every request, so it does not need to be included in the URL. Ensure that the API endpoint URL is correct, that your account has the relevant product enabled, and that you provide all required parameters (typically lat and lon for point queries).

Date/Time Macros (API URL)

Optional

Optionally, the API URL can be customized using macros—all macros added to the API URL will be converted into values when Nexla executes the API call. Macros are particularly useful for Breezometer endpoints that accept datetime, start_datetime, or end_datetime parameters — for example, to always fetch the last 24 hours of air-quality history.

Breezometer expects ISO 8601 datetimes for datetime, start_datetime, and end_datetime. Pair date/time macros with an ISO 8601-compatible date format (for example, yyyy-MM-dd'T'HH:mm:ssXXX) so the rendered URL is accepted by the API.

  1. To add a macro, type { at the appropriate position in the API URL (within the Set API URL field), and select the desired macro from the dropdown list.

    • {now} – The current datetime

    • {now-1} – The datetime one time unit before the current datetime

    • {now+1} – The datetime one time unit after the current datetime

    • custom – Datetime macros can reference any number of time units before or after the current datetime—for example, enter (now-24) with a Hour time unit to indicate the datetime 24 hours before the current datetime

  2. Select the format that will be applied to datetime macros from the Date Format for Date/Time Macro pulldown menu. Use an ISO 8601 format that matches the Breezometer datetime parameter — most endpoints accept yyyy-MM-dd'T'HH:mm:ssXXX.

  3. Select the datetime unit that will be used to perform mathematical operations in the included macro(s) from the Time Unit for Operations pulldown menu—for example, for the macro {now-1}, when Hour is selected, {now-1} will be converted to the datetime one hour before the current datetime.

Lookup-Based Macros (API URL)

Optional

Column values from existing lookups can also be included as macros in the API URL. Lookup-based macros allow you to reference data from previously configured data sources or lookups — for example, a list of monitored asset locations stored in a lookup can drive per-row calls to the Breezometer Air Quality or Wildfire Locate and Track endpoints, passing each asset's lat and lon into the URL.

Lookup-based macros are useful when you need to fan out Breezometer calls across a set of locations stored in another Nexla dataset — for example, fetching current AQI for every store in a retail footprint.

  1. To include a lookup column value macro, select the relevant lookup from the Add Lookups to Supported Macros pulldown menu.

  2. Type { at the appropriate position in the API URL, and select the lookup column-based macro from the dropdown list. Lookup-based macros are automatically populated into the macro list when a lookup is selected in the Add Lookups to Supported Macros pulldown menu.

Path to Data

Optional

If only a subset of the data returned by a Breezometer endpoint is needed, you can designate the part(s) of the response that should be included in the Nexset(s) by specifying the path to the relevant data within the response.

Most Breezometer JSON endpoints wrap the payload in a top-level data object. The pre-built templates set the path to data accordingly — $.data for point queries that return a single object, and $.data[*] for endpoints that return an array (such as /air-quality/v2/historical/hourly over a range, or /fires/v1/locate-and-track). Tile endpoints return binary payloads, and their templates use $ so the full response body is treated as one record.

Path to Data is essential for parsing Breezometer responses correctly. Without specifying the correct path, Nexla might surface the full envelope (including the data wrapper and metadata siblings) as a single record rather than extracting the underlying readings.

  • To specify which data should be treated as relevant in responses from this source, enter the path to the relevant data in the Set Path to Data in Response field.

    • For responses in JSON format enter the JSON path that points to the object or array that should be treated as relevant data. JSON paths use dot notation (for example, $.data for a single-object response or $.data[*] for an array response).
    Path to Data Example:

    For an Air Quality current-conditions point query (GET /air-quality/v2/current-conditions), enter $.data as the path to data. For a historical hourly range that returns an array, enter $.data[*]. For a tile endpoint that returns a binary PNG, enter $.

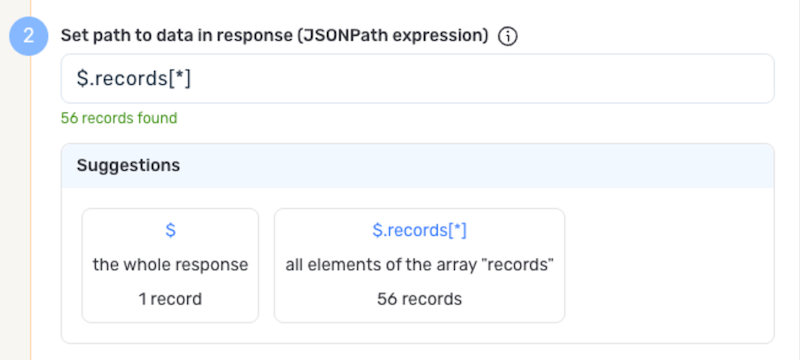
Autogenerate Path Suggestions

Nexla can also autogenerate data path suggestions based on the response from the API endpoint. These suggested paths can be used as-is or modified to exactly suit your needs.

  • To use this feature, click the Test button next to the Set API URL field to fetch a sample response from the API endpoint. Suggested data paths generated based on the content & format of the response will be displayed in the Suggestions box below the Set Path to Data in Response field.

  • Click on a suggestion to automatically populate the Set Path to Data in Response field with the corresponding path. The populated path can be modified directly within the field if further customization is needed.

    PathSuggestions.png

Metadata

If metadata is included in the response but is located outside of the defined path to relevant data, you can configure Nexla to include this data as common metadata in each record. This is useful when you want to preserve important contextual information that applies to all records but isn't part of the main data array.

For Breezometer, the metadata sibling of the top-level data object typically contains the calculation timestamp, geolocation echo, and source attribution. When path to data is set to $.data[*], capturing this metadata at $.metadata ensures each emitted record retains the request context.

Metadata paths are particularly useful for preserving Breezometer's source attribution — for example, sensor counts and provider names that document where the underlying readings came from.

  • To specify the location of metadata that should be included with each record, enter the path to the relevant metadata in the Path to Metadata in Response field.

    • For responses in JSON format, enter the JSON path to the object or array that contains the metadata (for example, $.metadata).

Request Headers

Optional
  • If Nexla should include any additional request headers in API calls to this source, enter the headers & corresponding values as comma-separated pairs in the Request Headers field (for example, header1:value1,header2:value2).

    You do not need to include any headers already present in the credentials. The Breezometer API authenticates via the key URL parameter (managed automatically by the credential), so no Authorization header is required.

Endpoint Testing

After configuring all settings for the selected endpoint, Nexla can retrieve a sample of the data that will be fetched according to the current configuration. This allows users to verify that the source is configured correctly before saving.

  • To test the current endpoint configuration, click the Test button to the right of the endpoint selection menu. Sample data will be fetched & displayed in the Endpoint Test Result panel on the right.

  • If the sample data is not as expected, review the selected endpoint and associated settings, and make any necessary adjustments. Then, click the Test button again, and check the sample data to ensure that the correct information is displayed.

Save & Activate the Source

  1. Once all of the relevant steps in the above sections have been completed, click the Create button in the upper right corner of the screen to save and create the new Breezometer data source. Nexla will now begin ingesting data from the configured endpoint and will organize any data that it finds into one or more Nexsets.